Freight Optimization

Engineering a High-Yield Network

In high-volume logistics, “activity” is often mistaken for “profitability.” ConnectCDI audits your freight network to prioritize high-yield opportunities. We shift focus from top-line revenue to the metrics driving valuation: Net Margin per Lane and Customer Utility.

Lane Profitability & Margin Forensics

Most TMS systems show you what a lane pays, but they rarely show you what that lane costs in real-time. CDI aggregates fuel, driver wages, maintenance, and opportunity costs to provide a true “All-In” margin.

  • Dynamic Margin Tracking: Visualize profitability shifts as fuel prices and deadhead miles fluctuate.
  • The “Bottom 10%” Report: Automatically identify the least profitable lanes in your network. This data gives you the leverage to either renegotiate rates or strategically exit the lane in favor of higher-margin freight.
  • Deadhead Reduction Intelligence: Our dashboards identify patterns in empty miles, suggesting backhaul opportunities that turn non-revenue miles into profit centers.

Customer Scorecards: Beyond the Rate Per Mile

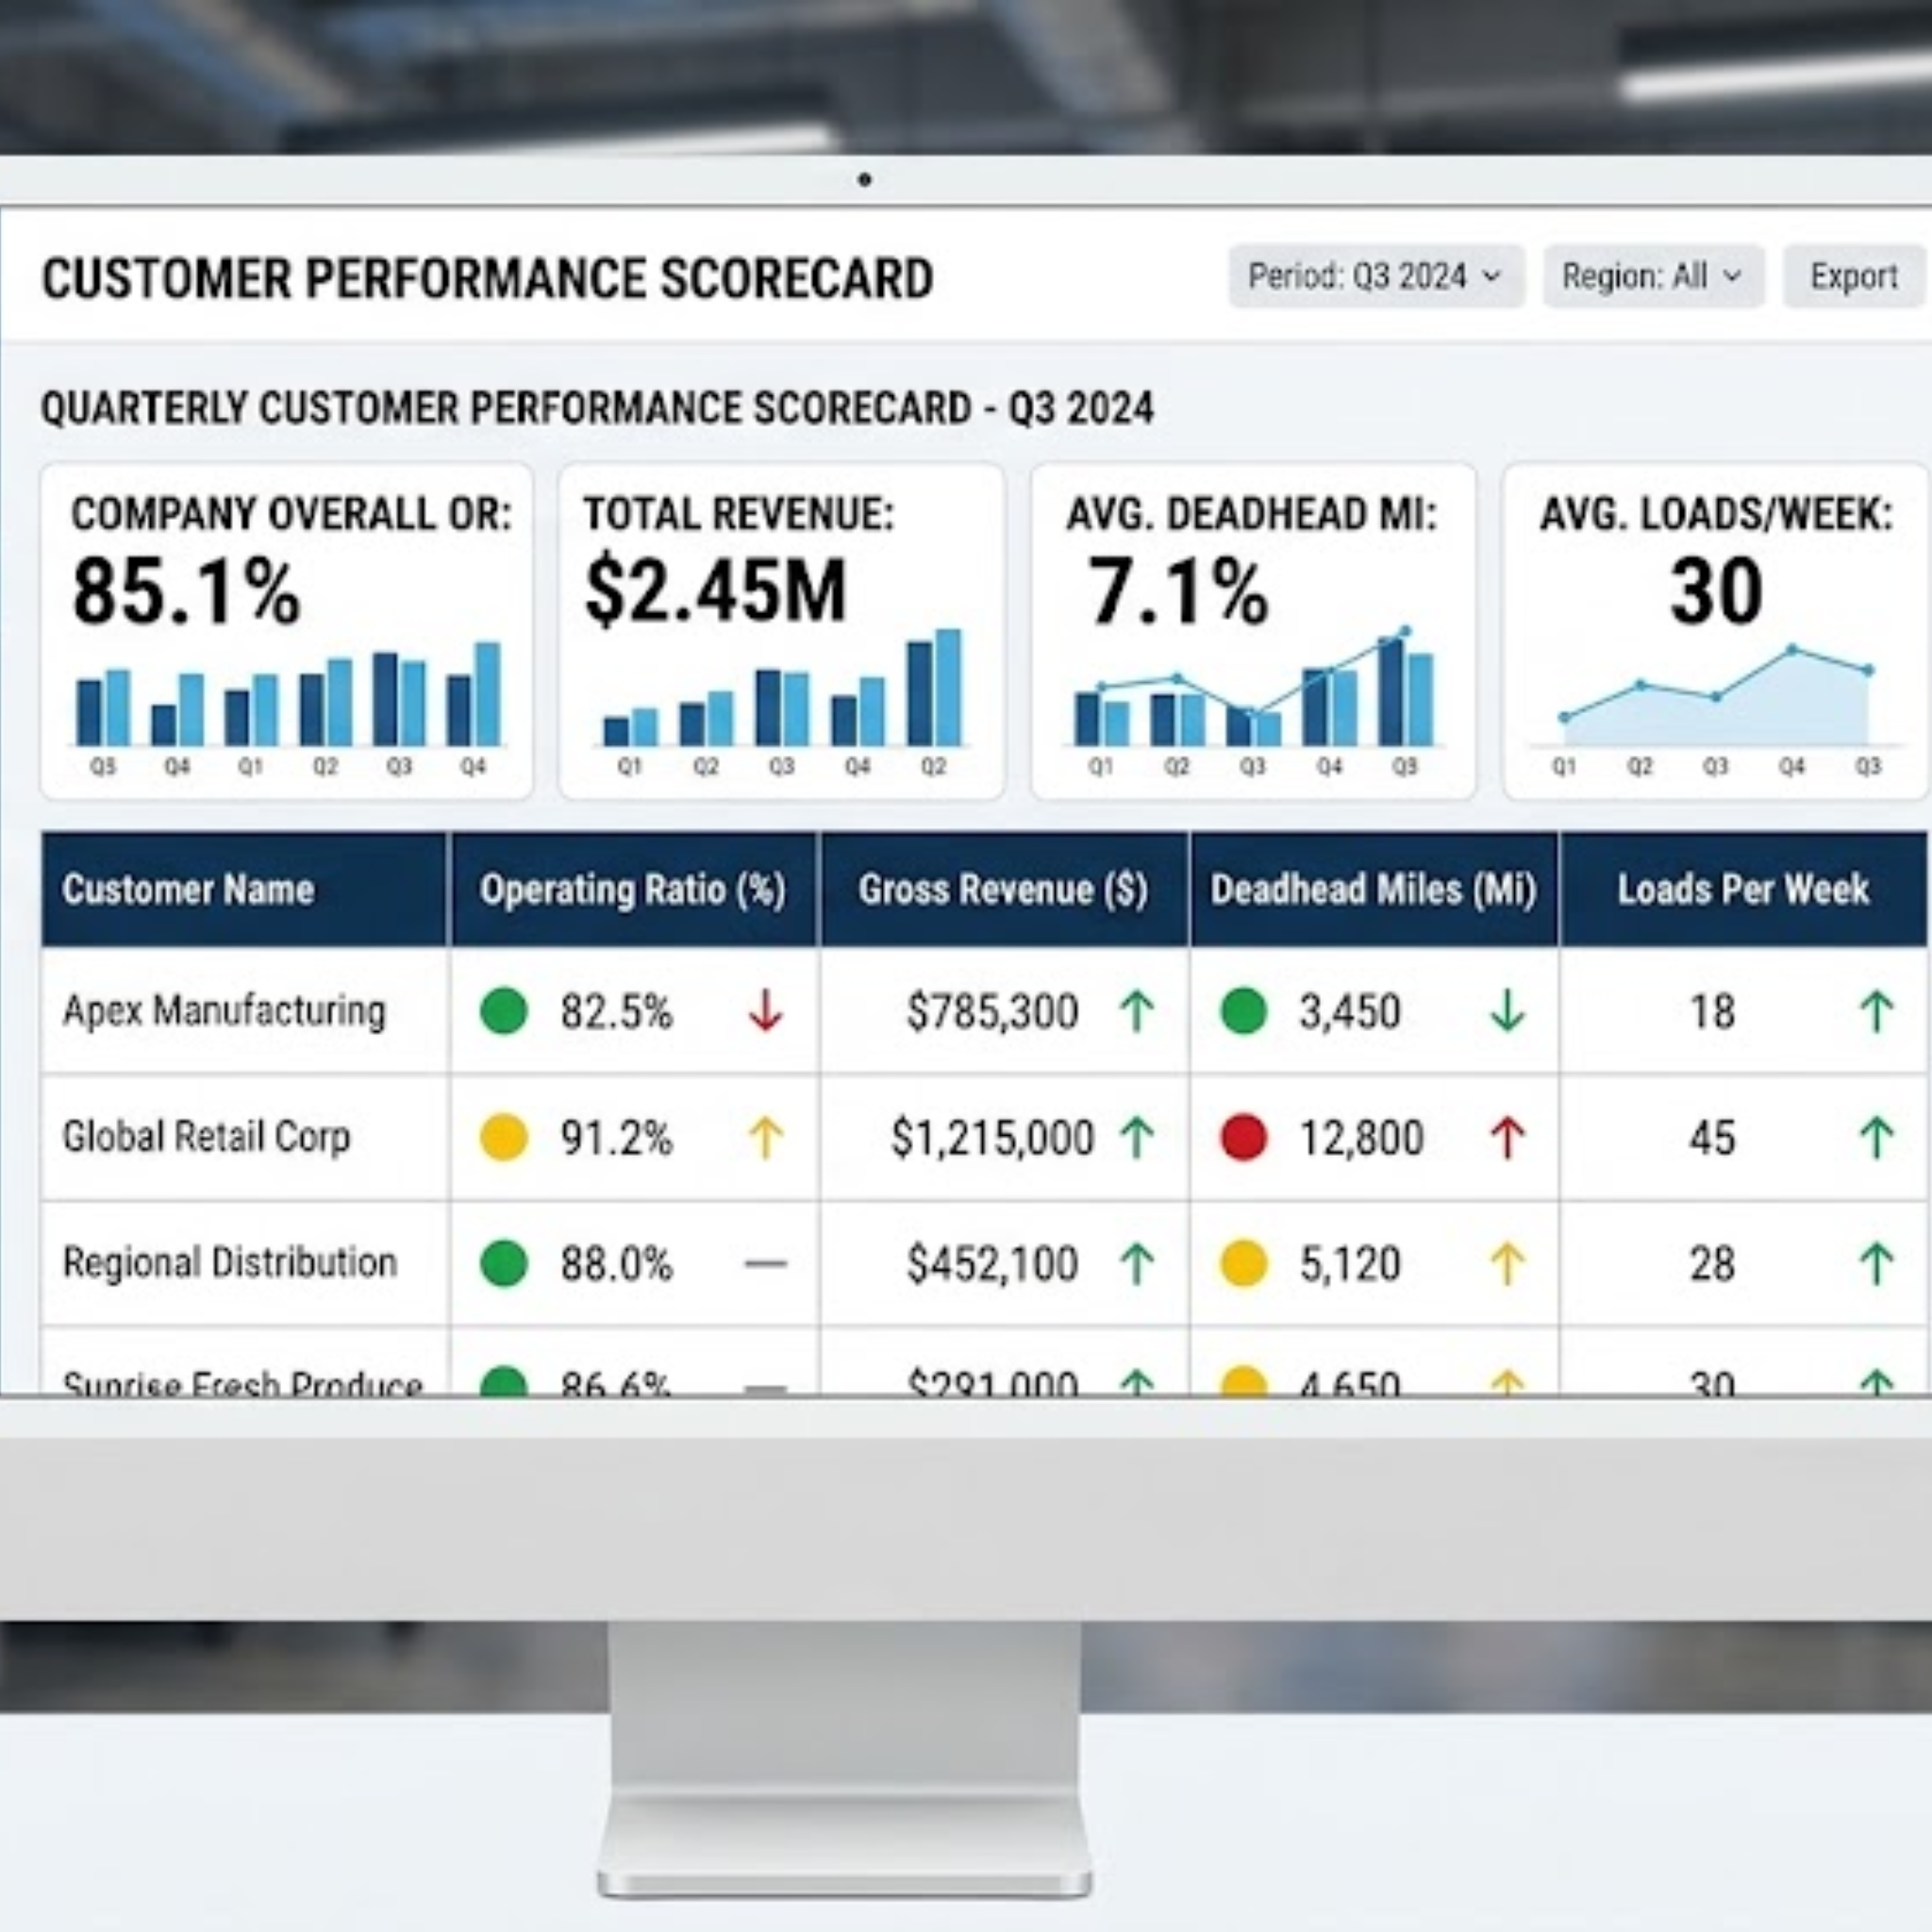
A high-paying load is a loss-leader if the driver is held at the dock for six hours. ConnectCDI creates comprehensive scorecards for every customer in your network.

  • Detention Time Analytics: Quantify exactly how much a customer’s inefficiency is costing you. If a shipper consistently exceeds two hours of load time, CDI calculates the “Lost Opportunity Cost” of that truck.
  • The “Driver Choice” Factor: Using data from our Collaborative Driver Interaction app, we correlate specific customers with driver frustration and turnover. If a certain freight provider is causing your drivers to quit, we provide the data to prove it.
  • Facility Efficiency Ratings: Identify which shippers offer the fastest turn-times, allowing you to reward them with more capacity and better service.

Capacity Elasticity & Predictive Sales

VPs of Sales need to know where their trucks will be before they get there. CDI provides the “Forward-Looking” visibility required to sell capacity more effectively.

  • Capacity Heat Maps: See where your fleet is clustering and where you are under-represented. This allows your sales team to aggressively target freight in “head-haul” markets.
  • Yield Sensitivity Analysis: Run “What-If” scenarios to see how a 5% increase in rates or a 10% reduction in deadhead would impact your quarterly EBITDA.

Private Equity & Valuation Readiness

A freight network that is optimized for margin rather than just volume is significantly more attractive to investors.

  • Clean Data for Due Diligence: Our dashboards provide the high-resolution data that PE firms look for during acquisitions. Prove the stability and profitability of your customer base with a few clicks.
  • Diversification Reporting: Visualize your customer concentration risk to ensure your fleet isn’t overly dependent on a single shipper or industry vertical.